Measuring the angles
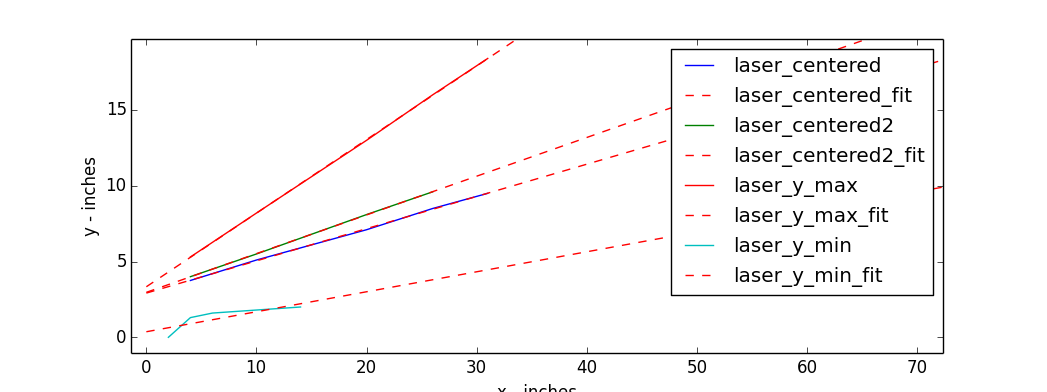
So here are the results of the angle measurements we performed. The give the height of the laser with respect to distance. Note that in the linear fit the slope is the tan(theta).
file: laser_centered.txt, theta: 0.20951161580084668, tan(theta): 0.2126319261370722
file: laser_centered2.txt, theta: 0.25012910850203685, tan(theta): 0.25547945206714767
file: laser_y_max.txt, theta: 0.4521309884472584, tan(theta): 0.4856860158312083
file: laser_y_min.txt, theta: 0.13117020868050436, tan(theta): 0.13192771084148025
delta theta:0.320960779766754
As you can see from the following graph, with the exception of the y_min measurments, we’re pretty spot on. and even then, the y_min is good enough for jazz.
Reproducing
Here is the code used to calculate the measurements.
from itertools import tee
from os.path import splitext
from numpy import loadtxt, array, linspace, sort, arctan
from scipy.optimize import curve_fit
from matplotlib.pyplot import plot, show, legend, xlabel, ylabel, axis

def linear(x, a, b):
    return a*x + b

DATA_FILES = ['laser_centered.txt' , 'laser_centered2.txt', 'laser_y_max.txt', 'laser_y_min.txt']

def every_other(iterable1, iterable2):
    for x, y in zip(iterable1, iterable2):
        yield x
        yield y

if __name__ == '__main__':
    thetas = []
    for data_f in DATA_FILES:
        vals = loadtxt(data_f)
        x, y = sort(vals, axis=0).T
        x -= 4
        (a,b), _ = curve_fit(linear, x,y)
        plot(x, y)
        xs = linspace(0,100)
        plot(xs, linspace(0,100)*a+b, 'r--')
        print("file: {}, theta: {}, tan(theta): {}".format(data_f, arctan(a), a))
        thetas.append(arctan(a))

    print("delta theta:{}".format(max(thetas) - min(thetas)))
    names, names2 = tee(map(lambda x: splitext(x)[0], DATA_FILES))
    names_fit = map(lambda x: "{}_fit".format(x), names2)
    legend(list(every_other(names, names_fit)))
    xlabel('x - inches')
    ylabel('y - inches')
    show()